monitoring
In recent years we have witnessed a rapid evolution of information infrastructures that have become increasingly complex and heterogeneous. The introduction of virtualization, thanks to the economic savings and its simplicity, has encouraged the increase in the number of servers divided then by functions and roles. Technologies like the Cloud have allowed to extend the company boundaries, just think of the hybrid Cloud or the public Cloud where previously physical servers that were physically present in the company have evolved in virtual instances in executions on more Datacenter also geographically distributed on the globe. Last but not least, the IoT (Internet of Things) has contributed to enrich the network of devices on the network and that it is necessary to manage.
The age of check-lists
Not many years ago, the system operators had sufficient check-lists, regularly performed according to work procedures, to monitor the company server pool and thus ensure the correct functioning of all the IT components, with particular attention to the business critical systems. Today this approach, as well as expensive, would be ineffective, mainly because of how the company infrastructure has evolved. The manual controls would become not only numerous but also unmanageable and with an inherently high degree of error. Moreover, in this scenario, it is not possible to guarantee a correct timeliness in the identification of a problem or in the management of a breakdown.
Automated monitoring
The evolution of the IT model has introduced the need to introduce new ways of controlling the network that are automated or semi-automated, distributed and above all pro-active / reactive. In fact, solutions have been developed capable of managing an increasingly high, heterogeneous and distributed number of network devices. The new monitoring systems are also able to set the frequency of the measurements based on the metrics observed, increasing it for those values in continuous change that it is necessary to observe therefore continuously and decreasing it for the more static ones. For example, disk space occupation in some environments may vary less than the network bandwidth. This precaution allows to optimize the resources of the monitoring avoiding to measure continuously less dynamic variables.
The evolutions of these monitoring systems have also made it possible to collect data centrally with the possibility of comparing different metrics to each other thus obtaining the composed metrics. Not merely measuring a single metric but comparing its value in relation to another (even different systems) has extended the concept of monitoring.
Item and Trigger
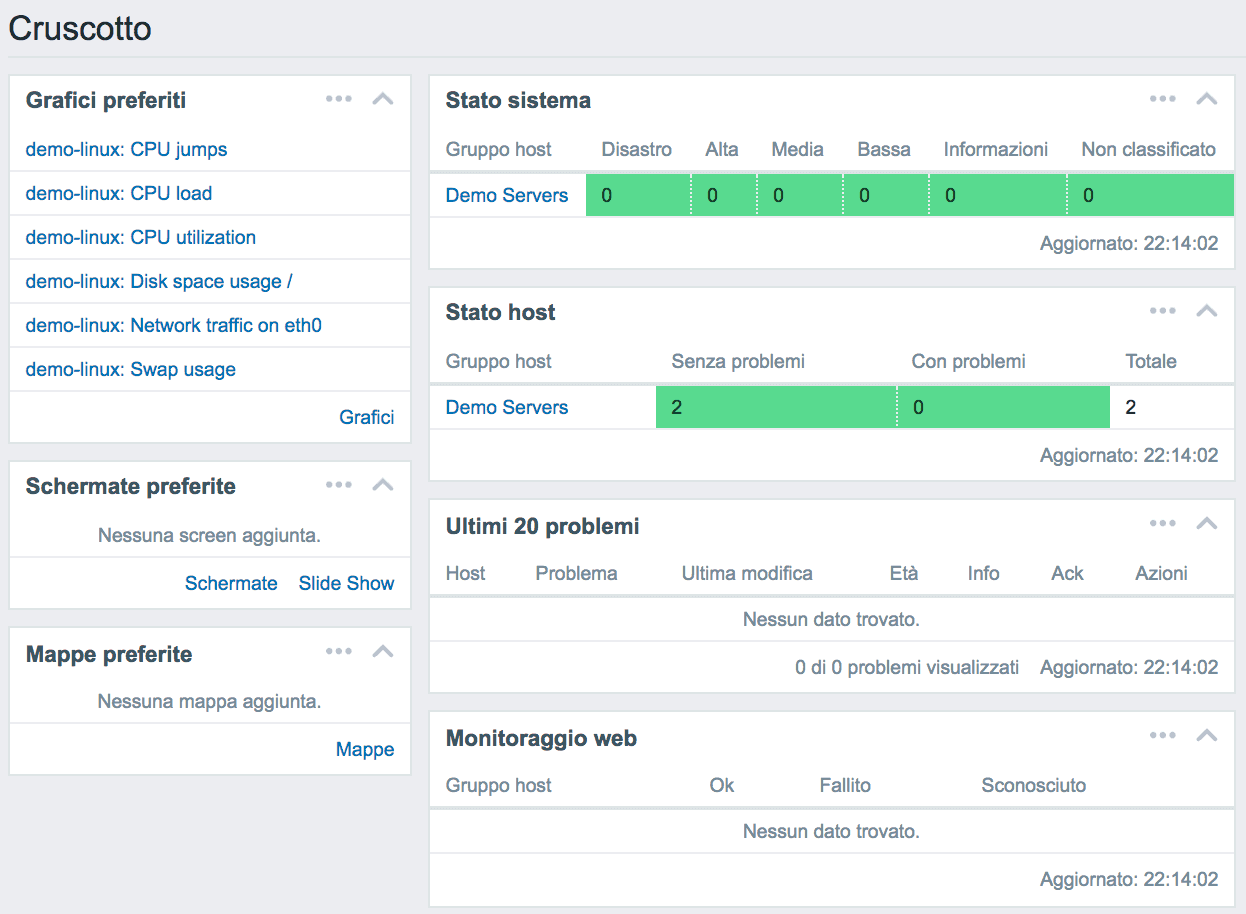
In the systems world or systems monitoring applications there are two basic concepts such as Item and Trigger. The first, Item, represent the metrics or the value (numeric, Boolean, textual) measured or to be measured (eg cluster status, CPU usage, disk usage, etc) while the seconds, Triggers, are the thresholds that you want to apply to a certain Item to check its value. For example, you may need to set two Triggers to monitor the volume occupation of a SAN by receiving a first notification if this exceeds 80% of the maximum capacity and a second in the case of 90%. This modular feature (Item and Trigger) allows for example to simply monitor the trend of a given metric (eg data center band) without necessarily applying a triggger to the measurement or allows to apply more thresholds to the same item to monitor the change in value reporting the change with different actions based on the triggers.
Actions
Upon the occurrence of a certain condition identified by the triggers, it is possible to perform a specific action such as sending an email, a text message, a VoIP call or running a program. For example, you could monitor a log file (item log file equal to catalina.log) and upon the occurrence of a certain condition (trigger that verifies the presence of a certain pattern) restart the relative application. In addition to being automated, actions can also be manual, leaving the monitoring system operator the possibility to apply them when it is deemed most appropriate.
Solution for monitoring the IT infrastructure
The Secure Online Desktop provides its customers with two monitoring services:
◊ IT monitoring service: This service is a complete solution for monitoring the customer’s IT infrastructure without needing to install additional hardware. The solution involves the use of a Cloud management console and a set of specific software agents that our staff will install.
◊ Managed monitoring service: This service is an add-on to the Cloud Server service that plans to monitor the Cloud servers that the customer buys.
[btnsx id=”2931″]
Useful links:
Customers
Twitter FEED
Recent activity
-
SecureOnlineDesktop
Estimated reading time: 6 minutes L'impatto crescente delle minacce informatiche, su sistemi operativi privati op… https://t.co/FimxTS4o9G
-
SecureOnlineDesktop
Estimated reading time: 6 minutes The growing impact of cyber threats, on private or corporate operating systems… https://t.co/y6G6RYA9n1
-
SecureOnlineDesktop
Tempo di lettura stimato: 6 minuti Today we are talking about the CTI update of our services. Data security is… https://t.co/YAZkn7iFqa
-
SecureOnlineDesktop
Estimated reading time: 6 minutes Il tema della sicurezza delle informazioni è di grande attualità in questo peri… https://t.co/tfve5Kzr09
-
SecureOnlineDesktop
Estimated reading time: 6 minutes The issue of information security is very topical in this historical period ch… https://t.co/TP8gvdRcrF
Newsletter
{subscription_form_1}© 2023 Secure Online Desktop s.r.l. All Rights Reserved. Registered Office: via dell'Annunciata 27 – 20121 Milan (MI), Operational Office: via statuto 3 - 42121 Reggio Emilia (RE) – PEC [email protected] Tax code and VAT number 07485920966 – R.E.A. MI-1962358 Privacy Policy - ISO Certifications


