


Monitor your IT infrastructure from Cloud console
- Centralized managed console
 Contact us
Web console to control the IT infrastructure
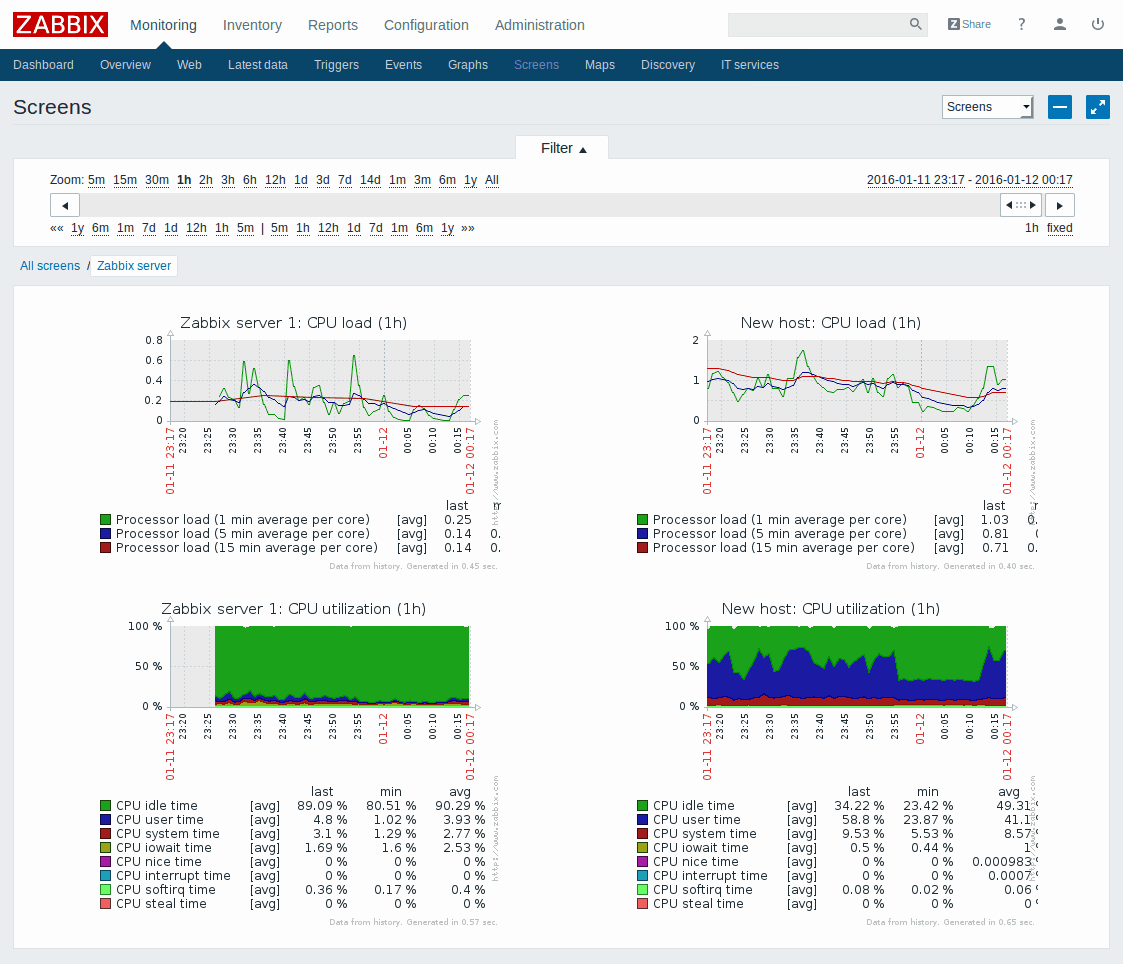
The monitoring service gives you control over your IT infrastructure by monitoring servers, virtual machines and network devices. Using the web console, monitor the appearance of your systems such as performance, system variables and much more. Get a quotationKeep an eye on every aspect of your IT infrastracture
You can monitor any aspect of your network: server performance and availability, web applications, databases, network devices and much more. You can control your IT infrastructure using performance indicators like CPU, memory, network, disk space and processes.
With or without agents
Measurement of monitored system metrics is extremely simple thanks to the software agents available for Linux, Unix and Windows. Agents use native processes so you will not need to have special environments like Java or .Net. All components of the monitoring architecture can be performed by non-privileged users, which is particularly important for native agents. Also, running monitoring demons on a privileged account requires additional steps. The components communicate with each other and only accept connections from authorized IP addresses, other connections are automatically rejected. Where it is not possible to install the software agents, the service provides agent-less monitoring to check the availability and reactivity of standard services like a mail or web server without installing any software on the monitored devices .
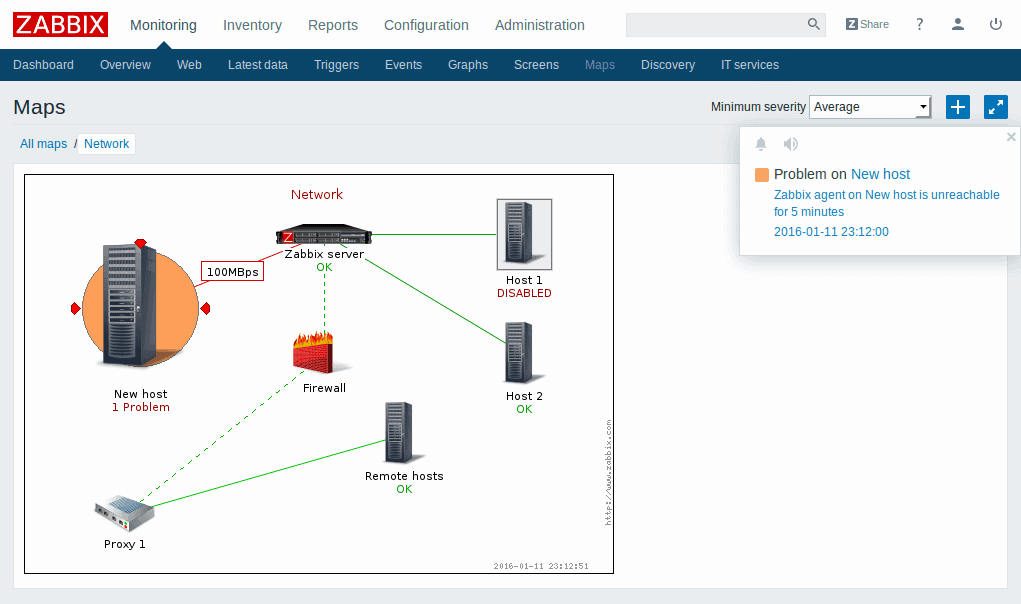
Network devices
IT Monitoring supports SNMP agents, present on all network devices such as routers and switches. The service is a valid aid for monitoring and capacity planning of your network by providing measurements such as network usage, CPU, memory and status of the logic gates. In addition you can monitor any other device with SNMP agents such as network appliance, storage, cooling and power system.
VMware Monitoring
The VMware virtual machine module allows monitoring of VMware vCenter and vSphere for different types of VMware hypervisors and different virtual machine metrics. Low-level scanning rules can be used to automatically detect VMware hypervisors and virtual machines and monitor them. Pre-configured templates are available to monitor virtual components quickly.
Customization
The extreme ability to carry out complex customizations allows you to integrate the solution in any environment and collect data from financial systems, control systems and even sophisticated search devices. There are no limits in the scripting language or programming to be used, it is possible to write the controls in shell, Perl, Python or any other language.
Database Monitoring
With the IT Monitoring service it is possible to monitor in extreme detail any database including MySQL, PostgreSQL, Oracle and Microsoft SQL Server.
Monitoring of Java applications
It is possible to monitor Java applications using JMX, it is not necessary to use third-party modules or integrations. In fact, it will be possible to monitor JBoss, Tomcat, Oracle Application Server and others through the Java gateway.
Web Services
Today, more and more information is being distributed through websites or IT web-based systems. To enable continuous monitoring of these systems, the service provides built-in support for web monitoring. With this functionality it will be possible to define sequential steps to be taken to analyze the website. This functionality allows the monitoring of availability, response times and download speed of external sites, e-commerce portals, internal wikis, Service Desk systems and much more.
Hardware Monitoring
If the hardware you want to control provides access to IPMI, then it will be possible to collect information such as temperature, fan voltage and disk status by avoiding downtime and 'interruption of the service provided. In addition, with the IT Monitoring service it is possible to execute IPMI commands to switch devices on the network on or off in case of faults.
How it works
After an initial assessment with our network architect, the computer perimeter to be monitored, the level of control and the alert mode will be agreed with the customer. Then our delivery team will take care of installing and configuring agents on systems to be monitored. At the end of the configuration operations the customer will receive a secure access to his Cloud console from which he will be able to check all the monitored metrics, view the system performances and manage corrective actions.
Download brochureONLINE DEMO
Try our demo:
SOFTWARE AGENTS
Supported agents:
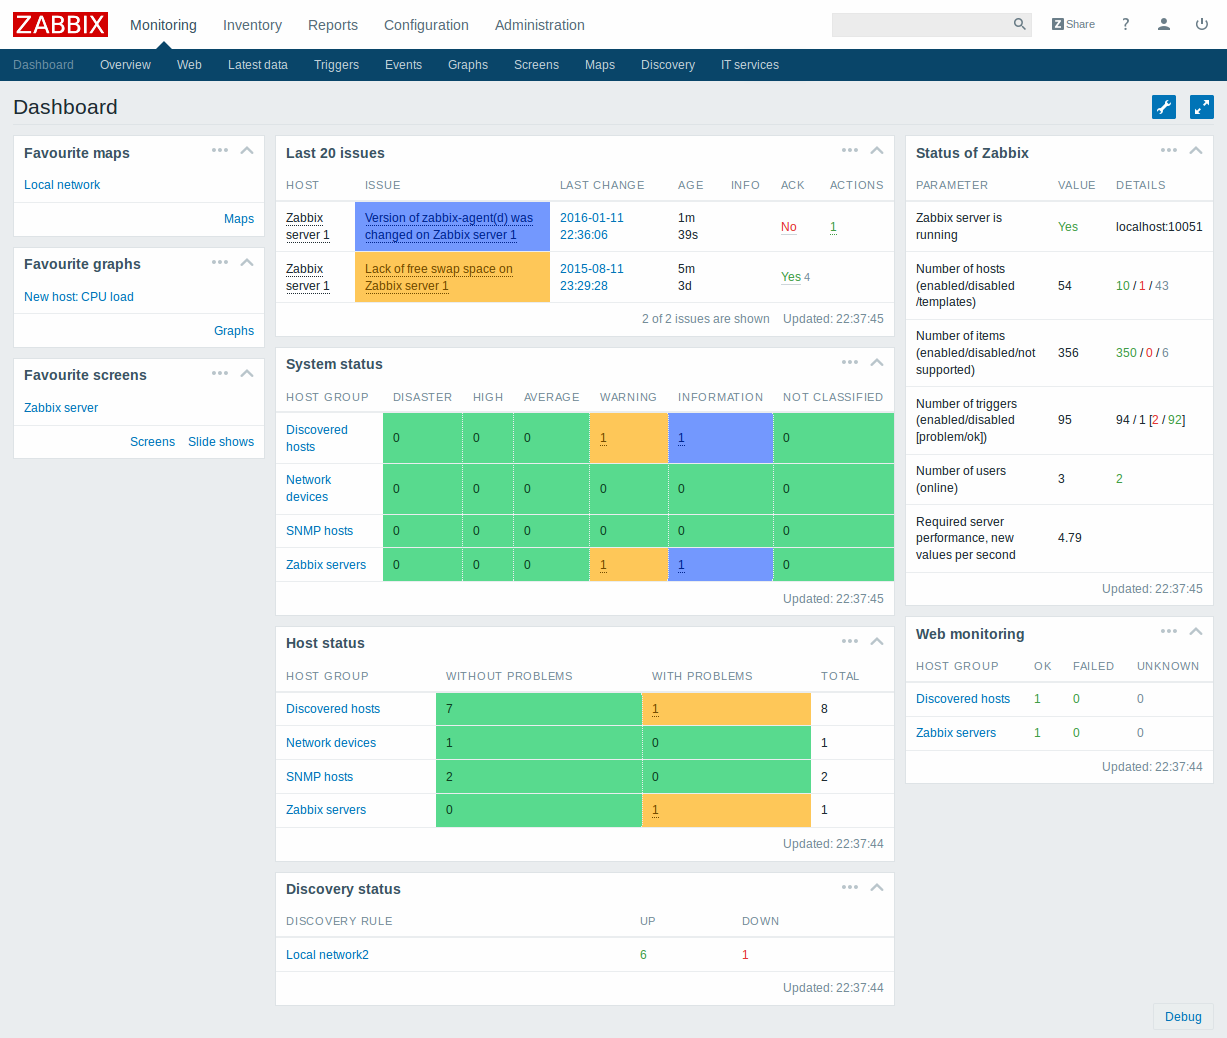
ALERTS
Alerts and notifications:
SCRENSHOTS
Monitoring:
ENTERPRISE READY
It manages any type of ICT infrastructure from small to large
Customers


Twitter FEED
Recent activity
-
SecureOnlineDesktop
Estimated reading time: 6 minutes L'impatto crescente delle minacce informatiche, su sistemi operativi privati op… https://t.co/FimxTS4o9G
-
SecureOnlineDesktop
Estimated reading time: 6 minutes The growing impact of cyber threats, on private or corporate operating systems… https://t.co/y6G6RYA9n1
-
SecureOnlineDesktop
Tempo di lettura stimato: 6 minuti Today we are talking about the CTI update of our services. Data security is… https://t.co/YAZkn7iFqa
-
SecureOnlineDesktop
Estimated reading time: 6 minutes Il tema della sicurezza delle informazioni è di grande attualità in questo peri… https://t.co/tfve5Kzr09
-
SecureOnlineDesktop
Estimated reading time: 6 minutes The issue of information security is very topical in this historical period ch… https://t.co/TP8gvdRcrF
Newsletter
{subscription_form_1}Products and Solutions
Partners
Cloud Models
News
- NIS: what it is and how it protects cybersecurity April 22, 2024
- Advanced persistent threats (APTs): what they are and how to defend yourself April 17, 2024
- Penetration Testing and MFA: A Dual Strategy to Maximize Security April 15, 2024
- Penetration Testing: Where to Strike to Protect Your IT Network March 25, 2024
- Ransomware: a plague that brings companies and institutions to their knees. Should you pay the ransom? Here is the answer. March 6, 2024
Google Reviews


Ottima azienda, servizi molto utili, staff qualificato e competente. Raccomandata!read more
Ottimo supportoread more
E' un piacere poter collaborare con realtà di questo tiporead more
Un ottimo fornitore.
Io personalmente ho parlato con l' Ing. Venuti, valore aggiunto indubbiamente.read more

About
© 2023 Secure Online Desktop s.r.l. All Rights Reserved. Registered Office: via dell'Annunciata 27 – 20121 Milan (MI), Operational Office: via statuto 3 - 42121 Reggio Emilia (RE) – PEC [email protected] Tax code and VAT number 07485920966 – R.E.A. MI-1962358 Privacy Policy - ISO Certifications