


 Giacomo Lanzi
Monitoring system, an overview
Estimated reading time: 5 minutes
Zabbix is a monitoring system suitable for different IT components, including networks, servers, virtual machines (VMs) and cloud services. Zabbix provides metrics such as network usage, CPU load, and disk space consumption. The software monitors operations on Linux, Hewlett Packard Unix (HP-UX), Mac OS X, Solaris, and other operating systems (OS);however, Windows monitoring is only possible through specific agents.
SOD offers you the service based on your needs. Once a first contact has been established, the customer is followed throughout the process of defining the perimeter and applying the monitoring system. Alert and control level are defined in accordance with the needs.
Monitoring system with and without agents
Zabbix can be used both with agents and without agents (software dedicated to collecting information in a system). Agents are optionally installed on IT components to monitor performance and collect data. The agent then responds to a centralized management server. This information is included in the reports or presented visually in the web-based graphical interface. If there is a problem with what is being monitored, the system sends a notification or warning to the user. Agentless monitoring performs the same type of monitoring by using existing resources in a system or device to emulate an agent.
The Zabbix web-based graphical interface allows users to visualize their IT environment via customizable dashboards based on widgets, charts, network maps, slideshows and reports. For example, a user can customize a report to show metrics associated with both SLAs (Service Level Agreements) and KPIs (Key Performance Indicators) on CPU loads.
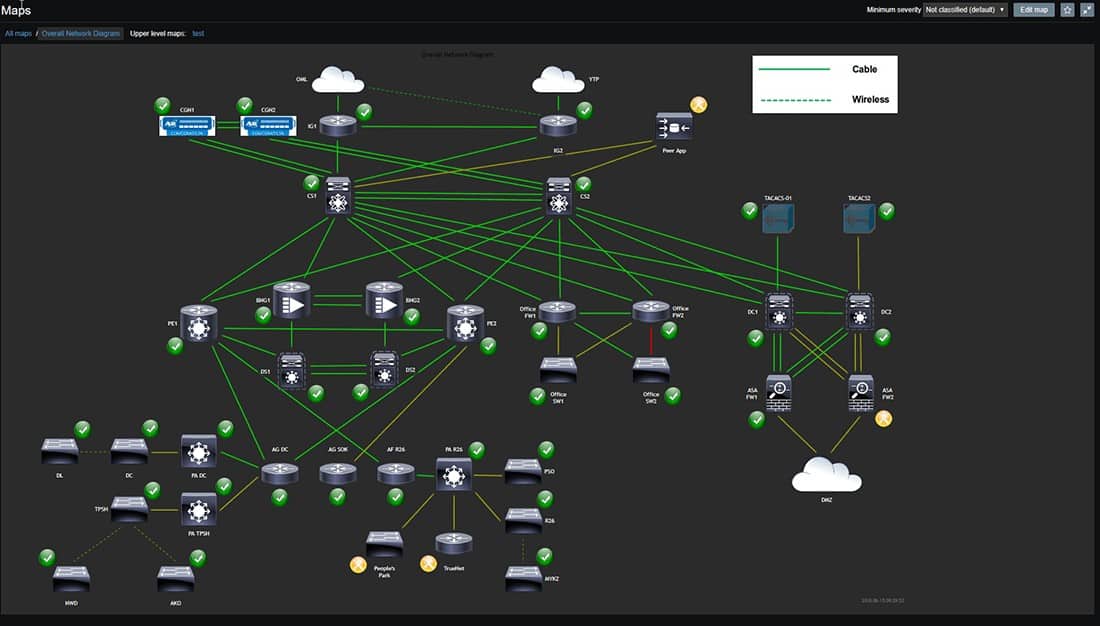
An example of a map of the monitoring system within a perimeter
The three discovery modes
The monitoring system offered works through three discovery mode options:
– Network discovery periodically scans an IT environment and records device type, IP address, status, uptime and downtime.
– Low-level discovery (LLD) automatically creates elements, triggers and graphs based on the discovered device. Low-level discovery can create metrics from Simple Network Management Protocol (SNMP) object identifiers, Windows services, Structured Query Language (SQL) queries, network interfaces, and more.
– Auto-discovery automatically starts monitoring any device discovered using a Zabbix agent.
With the distributed monitoring system, scripts run remotely collect data from multiple devices in distributed locations and combine them into a single dashboard or report, such as server availability across the country.
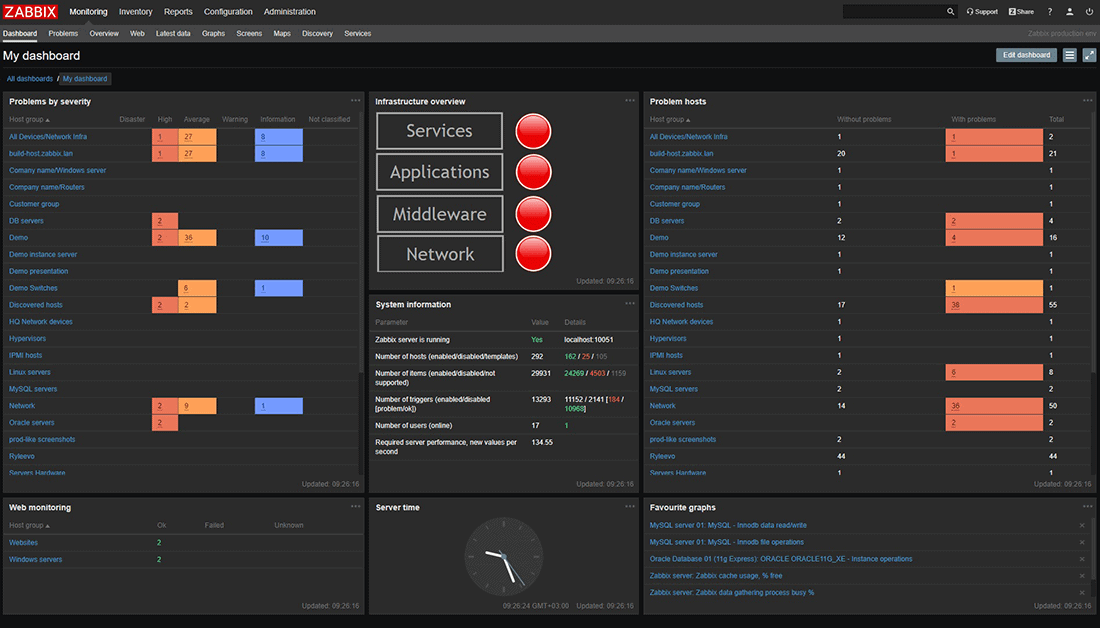
The graphical interface offers data ranging from system health to error severity and location, as well as monitoring details
The system can send notifications via e-mail, sms, telephone calls, notifications via API based on predefined events in a user’s IT environment. Another way for users to stay updated on their IT environment is through vendor applications such as M7 Monitoring or applications of their own creation.
Agentless monitoring system
Zabbix offers several monitoring options in addition to agents. A simple check can verify the availability and responsiveness of a standard service, such as notifications.
Java management extensions (JMX), web monitoring, and other methods are also alternatives to using agents. In the service offered, JMX can be used to monitor Java based applications. Web monitoring is used to check the availability of websites and supports HTTP and HTTPS. The system collects data relating to the average download speed of a scenario, errors and error messages, response times and more.
The Zabbix API
The system provides web-based APIs to create new applications, automate tasks and integrate with third-party software.The JavaScript Object Notation (JSON) format is used to use the API as a front-end web interface.
The Zabbix API consists of many methods which are grouped into separate APIs, each of which performs a specific service. For example, one method to create a new host is host.create; the method to log in as administrator is user.login. Using the API, monitoring system users can create applications to work with and view desired information.
Template
Templates are custom add-ons that extend the functionality of the monitoring system offered. Some models are made by Zabbix and come packaged with ready-to-use software, while others are built by users. Templates allow Zabbix users to monitor network devices from vendors such as Cisco, Dell, HP and Juniper. Other models can be used to monitor IBM, HP and Super Micro servers. Templates for application-based services include Microsoft Exchange and Exchange Server, Zenoss, PowerDNS, Authoritative Server Stats, and more. Templates can be created to monitor operating systems as well.
Conclusions
SOD provides an advanced monitoring system service that will allow you to keep your entire IT infrastructure under control. The monitoring possibilities are very wide and we have covered them in another article. The web interface facilitates the management and control for your perimeter, adding the possibility to set customized alarms and specific templates for every need.
If you are interested in the service, you can test it and see it working in our demo. Registration is required but no payment. Contact us for further questions or request a consultation, we are at your disposal.
Useful links:
SIEM software: what it is and how it works
ICT Monitoring Service
Acronis Active Protection: defense against ransomware
Contact us
Share
RSS
More Articles…
- NIS: what it is and how it protects cybersecurity
- Advanced persistent threats (APTs): what they are and how to defend yourself
- Penetration Testing and MFA: A Dual Strategy to Maximize Security
- Penetration Testing: Where to Strike to Protect Your IT Network
- Ransomware: a plague that brings companies and institutions to their knees. Should you pay the ransom? Here is the answer.
- Why IT audit and log management are important for Cybersecurity
- Red Team, Blue Team and Purple Team: what are the differences?
- Mercedes’ Oversight Puts Company Secrets at Risk: Why Cyber Threat Intelligence is Critical
Categories …
- Backup as a Service (18)
- Acronis Cloud Backup (11)
- Veeam Cloud Connect (4)
- Cloud Conference (3)
- Cloud CRM (1)
- Cloud Server/VPS (22)
- Conferenza Cloud (4)
- ICT Monitoring (5)
- Log Management (2)
- News (24)
- ownCloud (4)
- Privacy (7)
- Secure Online Desktop (14)
- Security (203)
- Cyber Threat Intelligence (CTI) (8)
- Deception (4)
- Ethical Phishing (11)
- Netwrix Auditor (2)
- Penetration Test (11)
- Posture Guard (3)
- SOCaaS (65)
- Vulnerabilities (84)
- Web Hosting (15)
Tags
 darkreading
- 'DuneQuixote' Shows Stealth Cyberattack Methods Are Evolving. Can Defenders Keep Up? May 2, 2024A recent campaign targeting Middle Eastern government organizations plays standard detection tools like a fiddle. With cyberattackers getting more creative, defenders must start keeping pace.
- Private Internet Search Is Still Finding Its Way May 1, 2024The quest to keep data private while still being able to search may soon be within reach, with different companies charting their own paths.
- UnitedHealth Congressional Testimony Reveals Rampant Security Fails May 1, 2024The breach was carried out with stolen Citrix credentials for an account that lacked multifactor authentication. Attackers went undetected for days, and Change's backup strategy failed.
- Intel 471 Acquires Cyborg Security May 1, 2024
- Cobalt's 2024 State of Pentesting Report Reveals Cybersecurity Industry Needs May 1, 2024
- Shadow APIs: An Overlooked Cyber-Risk for Orgs May 1, 2024Unmanaged and unknown Web services endpoints are just some of the challenges organizations must address to improve API security.
- Qantas Customers' Boarding Passes Exposed in Flight App Mishap May 1, 2024Some customers found that they had the ability to cancel a stranger's flight to another country after opening the app, which was showing other individuals' flight details.
- 'Cuttlefish' Zero-Click Malware Steals Private Cloud Data May 1, 2024The newly discovered malware, which has so far mainly targeted Turkish telcos and has links to HiatusRat, infects routers and performs DNS and HTTP hijacking attacks on connections to private IP addresses.
- The Cybersecurity Checklist That Could Save Your M&A Deal May 1, 2024With mergers and acquisitions making a comeback, organizations need to be sure they safeguard their digital assets before, during, and after.
- Verizon DBIR: Basic Security Gaffes Underpin Bumper Crop of Breaches May 1, 2024MOVEit drove a big chunk of the increase, but human vulnerability to social engineering and failure to patch known bugs led to a doubling of breaches since 2023, said Verizon Business.
Full Disclosure
- Microsoft PlayReady white-box cryptography weakness May 1, 2024Posted by Security Explorations on May 01Hello All, There is yet another attack possible against Protected Media Path process beyond the one involving two global XOR keys [1]. The new attack may also result in the extraction of a plaintext content key value. The attack has its origin in a white-box crypto [2] implementation. More […]
- Defense in depth -- the Microsoft way (part 87): shipping more rotten software to billions of unsuspecting customers April 24, 2024Posted by Stefan Kanthak on Apr 24Hi @ll, this post is a continuation of and With the release of .NET Framework 4.8 in April 2019, Microsoft updated the following paragraph of the MSDN article "What's new in .NET Framework" | Starting with .NET Framework 4.5, the clrcompression.dll assembly...
- Response to CVE-2023-26756 - Revive Adserver April 24, 2024Posted by Matteo Beccati on Apr 24CVE-2023-26756 has been recently filed against the Revive Adserver project. The action was taken without first contacting us, and it did not follow the security process that is thoroughly documented on our website. The project team has been given no notice before or after the disclosure. Our team has […]
- BACKDOOR.WIN32.DUMADOR.C / Remote Stack Buffer Overflow (SEH) April 19, 2024Posted by malvuln on Apr 19Discovery / credits: Malvuln (John Page aka hyp3rlinx) (c) 2024 Original source: https://malvuln.com/advisory/6cc630843cabf23621375830df474bc5.txt Contact: malvuln13 () gmail com Media: twitter.com/malvuln Threat: Backdoor.Win32.Dumador.c Vulnerability: Remote Stack Buffer Overflow (SEH) Description: The malware runs an FTP server on TCP port 10000. Third-party adversaries who can reach the server can send a specially […]
- SEC Consult SA-20240418-0 :: Broken authorization in Dreamehome app April 19, 2024Posted by SEC Consult Vulnerability Lab via Fulldisclosure on Apr 19SEC Consult Vulnerability Lab Security Advisory < 20240418-0 > ======================================================================= title: Broken authorization product: Dreamehome app vulnerable version:
- MindManager 23 - full disclosure April 19, 2024Posted by Pawel Karwowski via Fulldisclosure on Apr 19Resending! Thank you for your efforts. GitHub - pawlokk/mindmanager-poc: public disclosure Affected application: MindManager23_setup.exe Platform: Windows Issue: Local Privilege Escalation via MSI installer Repair Mode (EXE hijacking race condition) Discovered and reported by: Pawel Karwowski and Julian Horoszkiewicz (Eviden Red Team) Proposed mitigation:...
- CVE-2024-31705 April 14, 2024Posted by V3locidad on Apr 14CVE ID: CVE-2024-31705 Title : RCE to Shell Commands" Plugin / GLPI Shell Command Management Interface Affected Product : GLPI - 10.X.X and last version Description: An issue in Infotel Conseil GLPI v.10.X.X and after allows a remote attacker to execute arbitrary code via the insufficient validation of user-supplied input. […]
- SEC Consult SA-20240411-0 :: Database Passwords in Server Response in Amazon AWS Glue April 14, 2024Posted by SEC Consult Vulnerability Lab via Fulldisclosure on Apr 14SEC Consult Vulnerability Lab Security Advisory < 20240411-0 > ======================================================================= title: Database Passwords in Server Response product: Amazon AWS Glue vulnerable version: until 2024-02-23 fixed version: as of 2024-02-23 CVE number: - impact: medium homepage: https://aws.amazon.com/glue/ found:...
- [KIS-2024-03] Invision Community <= 4.7.16 (toolbar.php) Remote Code Execution Vulnerability April 11, 2024Posted by Egidio Romano on Apr 10------------------------------------------------------------------------------ Invision Community
- [KIS-2024-02] Invision Community <= 4.7.15 (store.php) SQL Injection Vulnerability April 11, 2024Posted by Egidio Romano on Apr 10-------------------------------------------------------------------- Invision Community
Customers


Twitter FEED
Recent activity
-
SecureOnlineDesktop
Estimated reading time: 6 minutes L'impatto crescente delle minacce informatiche, su sistemi operativi privati op… https://t.co/FimxTS4o9G
-
SecureOnlineDesktop
Estimated reading time: 6 minutes The growing impact of cyber threats, on private or corporate operating systems… https://t.co/y6G6RYA9n1
-
SecureOnlineDesktop
Tempo di lettura stimato: 6 minuti Today we are talking about the CTI update of our services. Data security is… https://t.co/YAZkn7iFqa
-
SecureOnlineDesktop
Estimated reading time: 6 minutes Il tema della sicurezza delle informazioni è di grande attualità in questo peri… https://t.co/tfve5Kzr09
-
SecureOnlineDesktop
Estimated reading time: 6 minutes The issue of information security is very topical in this historical period ch… https://t.co/TP8gvdRcrF
Newsletter
{subscription_form_1}Products and Solutions
Partners
Cloud Models
News
- NIS: what it is and how it protects cybersecurity April 22, 2024
- Advanced persistent threats (APTs): what they are and how to defend yourself April 17, 2024
- Penetration Testing and MFA: A Dual Strategy to Maximize Security April 15, 2024
- Penetration Testing: Where to Strike to Protect Your IT Network March 25, 2024
- Ransomware: a plague that brings companies and institutions to their knees. Should you pay the ransom? Here is the answer. March 6, 2024
Google Reviews


Ottima azienda, servizi molto utili, staff qualificato e competente. Raccomandata!read more
Ottimo supportoread more
E' un piacere poter collaborare con realtà di questo tiporead more
Un ottimo fornitore.
Io personalmente ho parlato con l' Ing. Venuti, valore aggiunto indubbiamente.read more

About
© 2023 Secure Online Desktop s.r.l. All Rights Reserved. Registered Office: via dell'Annunciata 27 – 20121 Milan (MI), Operational Office: via statuto 3 - 42121 Reggio Emilia (RE) – PEC [email protected] Tax code and VAT number 07485920966 – R.E.A. MI-1962358 Privacy Policy - ISO Certifications